The Agency Reporting Dashboard provides valuable insights into the revenue generated through your social media, paid search, and organic search campaigns - revenue that can be directly attributed to the services provided by your agency. This article will walk you through the key elements of the dashboard, helping you better understand and leverage the data to make informed decisions about your marketing strategies.
Dashboard Overview
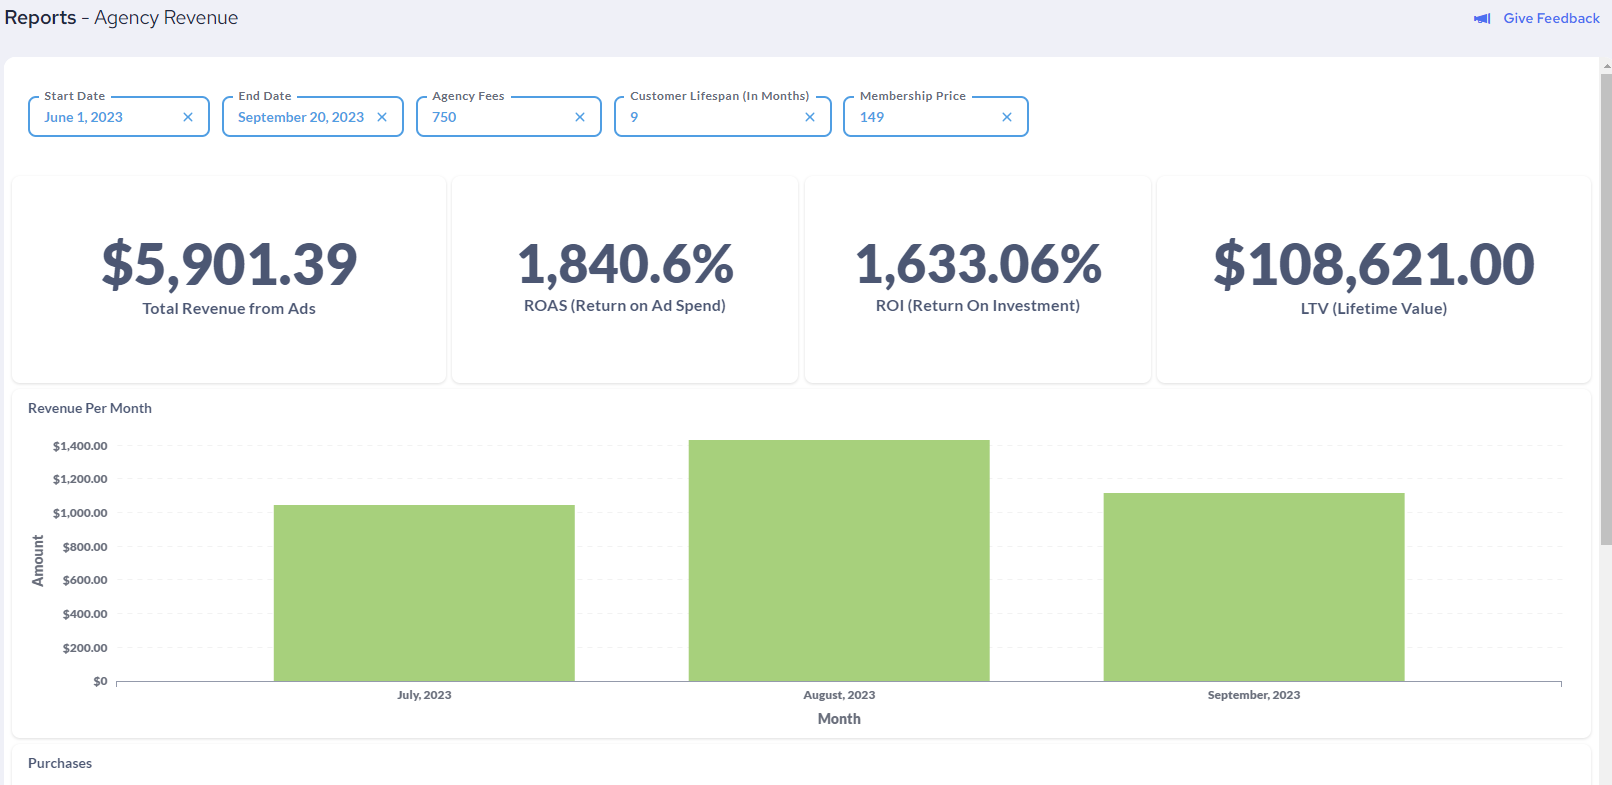
The dashboard offers a comprehensive overview of your revenue-related metrics, enabling you to gauge the effectiveness of your marketing efforts. Here are the main components of the dashboard:
1. Time Frame Selection
At the top of the dashboard, you can choose the time frame you'd like to analyze the data for. This allows you to tailor your analysis to specific periods, such as monthly, quarterly, or annually.

2. Agency Fee
The "Agency Fee" field represents the amount paid to your agency for managing your campaigns. While this field is currently manually inserted, there may be potential for automation in the future. Alternatively, it could be pre-filled or hidden if automation is not possible.
3. Customer Lifespan
The "Customer Lifespan" field indicates the average number of months a customer typically stays with your business. While you determine this value, your agency team can provide insights based on industry standards for average customer lifetime value.
4. Monthly Recurring Revenue (MRR)
"MRR" represents the average monthly revenue generated by an average member of your business. This metric helps assess the ongoing financial health of your business.

5. Total Revenue from Ads
This figure is the sum of all purchases made by leads generated through Referrizer Agency's efforts. It provides a clear view of the revenue directly attributable to your agency's marketing campaigns.
6. Return on Ad Spend (ROAS)
ROAS is the percentage of return you receive for every dollar invested in advertising. It's calculated by dividing the total ad spend in the reporting period by the total revenue from the ads.
7. Return on Investment (ROI)
ROI is the percentage of return on your overall investment, which includes ad spending and agency management fees. It helps you assess the profitability of your marketing campaigns.
8. Lifetime Value of Generated Leads
This metric estimates the long-term revenue to be expected from leads or clients generated by Referrizer Agency. It's based on industry standards and provides insights into the potential value of acquired customers over time.

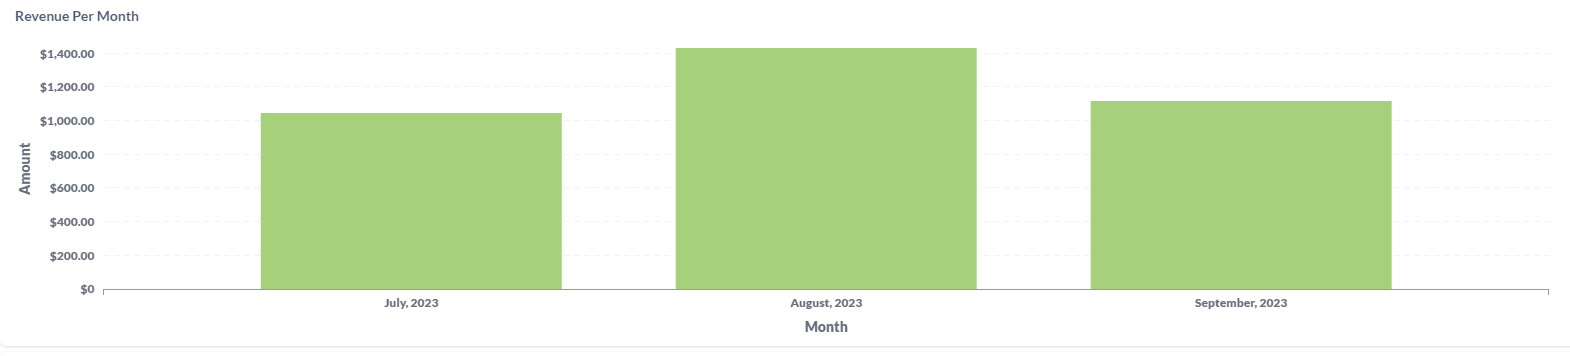
Monthly Revenue Chart
Below the key metrics, you'll find the "Revenue per Month" chart, which visualizes the revenue generated by your paid advertising efforts on a monthly basis. This chart helps track trends and performance over time.